
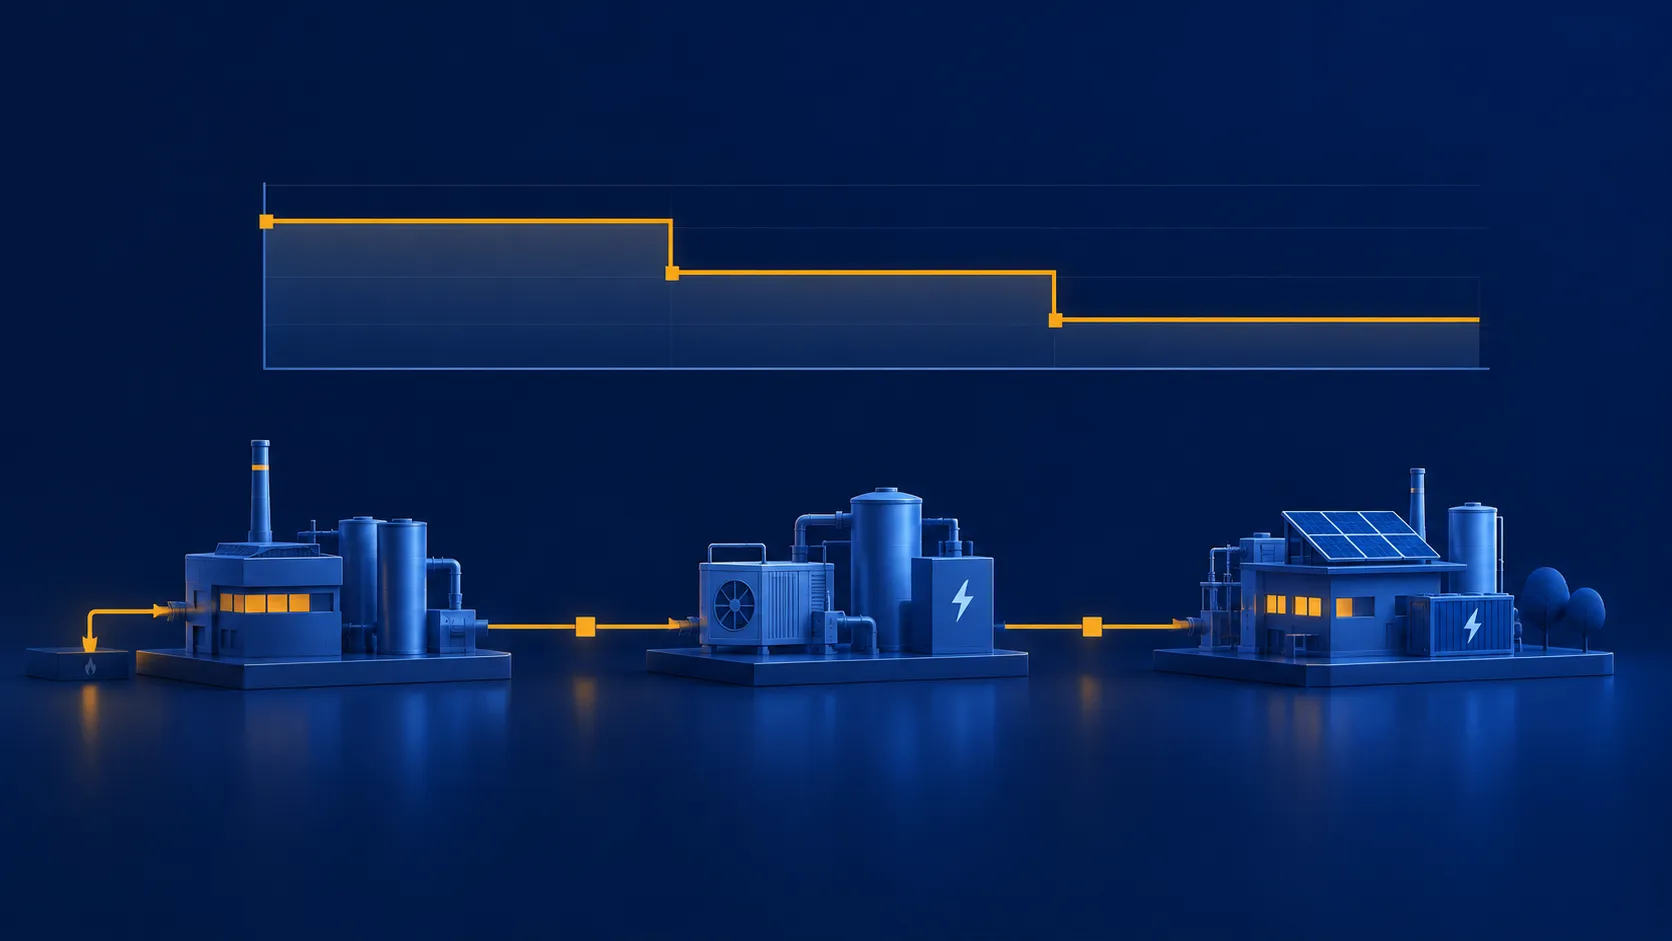
An industrial company that does nothing in the energy transition still sees its energy bill rise. One that invests without a plan risks buying the wrong assets at the wrong time. Hospitals face the same challenges, with large gas-fired energy systems that run around the clock. Using our simulation platform for complex industrial sites, we built a full energy transition roadmap for a 500-bed demo hospital to show where the money and the CO₂ really sit.
Factories, hospitals and other large sites use a lot of energy, often around the clock. Many still run on gas: a CHP for power and heat, gas boilers for hot water and steam. Their installations are large and often old, and there is little room for downtime.
Most companies and institutions have committed to climate goals on the way to net zero in 2050. Reaching them requires significant investments to decarbonise. At the same time, the rules are changing. From 2028, ETS2 puts a carbon price on gas for sites outside the existing EU emissions trading system. The Flemish CHP certificates run out by 2032 at the latest.
The question is no longer whether to act, but in which order. Which investments pay for themselves? Which ones cut CO₂ but raise the bill? When does the CHP have to go?
To make this concrete, we take a hospital as the example. It brings together what many industrial sites face: a high and constant heat demand, steam, a CHP, and strict requirements for back-up capacity and resilience. The same method applies to any site that runs on a gas-fired energy system.
The demo hospital
Our demo hospital has about 500 beds. This is its energy system today.
| Grid connection | 10 kV, 4 MW, with a peak demand of about 0.8 MW |
| Power and heat | 2.4 MW gas CHP, 2 MW steam gas boiler, 4 MW hot-water gas boiler |
| Other assets | 2 MWp solar PV, electric chillers, backup generator |
| Demand | 14.6 GWh of heat and 7.3 GWh of electricity a year |
| Contracts | Spot prices for both electricity and gas |
Doing nothing is not a cheap option
Before we look at any investment, we ask what happens if the site changes nothing. It is tempting to see that as the option without a cost: no investment, no risk. To test it, we take the hospital as it is today and run it through to 2040.
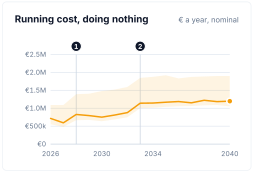
We keep that installation unchanged. Only the prices and the rules around it change. The running cost still rises from €716k in 2026 to €1.2M in 2040, or +67%. Two changes in the rules drive most of that:
- ETS2 from 2028: a carbon price on gas adds about €234k a year.
- The end of the CHP certificates after 2032 (at the latest): about €261k a year in lost income.
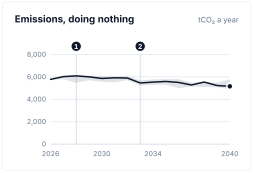
The emissions barely move in the meantime: −11% by 2040, far from a −75% goal. Standing still costs money and misses the targets. This is the baseline we compare every step of the roadmap against.
How we build the roadmap
We start from the site's own energy use and let the numbers pick the steps.
-
A digital twin of today
We build a model of the site as it runs today: its installations and its energy demand, hour by hour. Some changes are already decided, such as a nearby thermal unit that will close or an investment that is already approved. We include those in the year they take effect.
-
Five price scenarios
Gas and electricity prices follow five scenarios up to 2040, rooted in the plans of the Belgian and neighbouring governments.
-
A wide range of options
We test e-boilers, heat pumps, solar PV, batteries, thermal storage, building renovation and taking out the CHP or the gas boilers, each in several sizes.
-
The best end state
We pick the mix with the lowest running cost, the lowest investment and the largest CO₂ cut.
-
The best way to get there
We optimise the order and timing of the steps, so that early steps pay for later ones and the goals are reached on time.
What the demo hospital shows
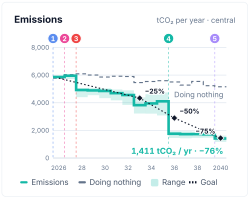
The roadmap for the demo hospital has five steps, spread over 15 years. Together they cost €2.1M. They bring the hospital's emissions down from 5,780 to 1,411 tCO₂ a year, a cut of 76% by 2040.
The hospital reaches each of its three goals along the way. In 2033 it is at −34%, against a goal of −25%. In 2036 it is at −70%, against a goal of −50%. In 2040 it ends at −76%, just past the goal of −75%.
The table lists the five steps in order.
| Step | Year | Change to the site | CAPEX | OPEX in 2040 | Simple ROI | CO₂ in 2040 |
|---|---|---|---|---|---|---|
| 1 | 2026 | Adds Battery 2 MWh | €360k | −€52k | 14%/yr | +126 tCO₂ |
| 2 | 2027 | Adds Solar PV 2.5 MWp | €765k | −€126k | 17%/yr | −241 tCO₂ |
| 3 | 2028 | Adds Heat pump 750 kW | €780k | −€185k | 24%/yr | −1,539 tCO₂ |
| 4 | 2036 | Adds E-boiler 1 MW Removes CHP | €152k | +€358k | n/a | −1,802 tCO₂ |
| 5 | 2040 | Removes Steam gas boiler | – | +€196k | n/a | −289 tCO₂ |
| Roadmap | €2.1M | +€191k | −3,746 tCO₂ |
Investment: most of it comes first
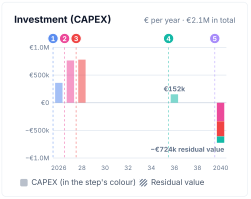
Most of the €2.1M is spent early. About €1.9M falls in the first three years, on the battery, the solar PV and the heat pump. These are no-regret steps. They lower the running cost from the start and pay back within 7 to 11 years. The e-boiler in 2036 adds only €152k. In 2040, the assets are still worth about €724k. That part of the investment is still on the books at the end of the horizon.
Emissions: the heat pump and the CHP exit do the heavy lifting
Two steps do most of the work. The heat pump in 2028 cuts 1,539 tCO₂ a year. Taking out the CHP in 2036 cuts another 1,802 tCO₂. With the other steps included, emissions fall from 5,780 to 1,411 tCO₂ a year, or −76%. If the hospital does nothing, they stay above 5,000 tCO₂.
One step goes the other way. The battery in step 1 raises emissions slightly (+126 tCO₂), because it lets the CHP run more when power prices are high. That effect ends when the CHP leaves. The hospital only reaches its 2040 goal with step 5, when the steam gas boiler goes. Before it removes the CHP and the steam boiler, it must check that it still has a secure supply of steam and power when one unit fails.
Running cost: below doing nothing until 2035
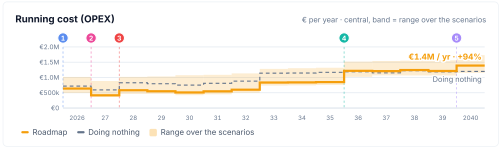
Until 2035, the roadmap is cheaper to run than doing nothing, in every price scenario. By 2040, steps 1 to 3 save €363k a year. That changes in 2036. Without the CHP, the site buys all its power and heats with electricity. This adds €555k a year.
In 2040, the running cost ends at €1.4M a year. In the central scenario, that is 16% above doing nothing. The band in the chart shows how much this depends on prices. When gas is expensive, doing nothing becomes the more expensive option. Over 2026–2040, the net present value ranges from −€603k to €1.7M. In the central case it is close to zero, at −€50k.
These figures are conservative. They count no investment subsidies. The battery and the e-boiler also earn nothing from imbalance or reserve markets in this calculation.
Why a roadmap pays off before the first investment
A roadmap is more than a study for the archive. It is the document a hospital keeps reaching for when decisions come up.
Calls often open with short deadlines and ask for a substantiated project: costs, CO₂ effect and timing. With a roadmap, those figures are already on the table.
It shows which steps give the most impact per euro, and which no-regret steps lower the running cost from day one.
Replacing a CHP or a boiler like for like can block the next step for 15 years. The roadmap shows what each replacement should be, and when.
In the demo hospital, the peak on the grid grows from 0.8 MW today to 1.9 MW in 2040. A larger connection takes years to obtain, so the request has to start early.
It turns climate goals into a multi-year investment budget that everyone can follow.
It feeds the action plan of an energy audit or an ISO 50001 energy management system, and makes progress against the goals easy to track.
Let's look at your site together
Every industrial site or hospital starts from a different place: another CHP, another grid connection, other processes, other goals. A roadmap built on your own data shows which steps pay for themselves, which ones cut the most CO₂ and when to take them. For companies or groups with several sites, we build one roadmap across all of them, so it shows where investments will pay off most.
Read the full report
The full report of the demo hospital's roadmap sets out the status quo, the goals, the end state, the steps and their impact on investment, emissions and running cost. It also covers the method, the assumptions, every option studied and the results in each price scenario.
The demo hospital uses synthetic data for a hospital of about 500 beds, loosely based on a published hospital energy case study (University of Extremadura). The figures show the method and the order of magnitude; they do not describe a specific hospital.